Statistics for AIML - Regression Metrics - Overview Tutorial
Total Absolute Error = |Y1 –Y1h| + |Y1 –Y1h| + …. + |Yn –Ynh|
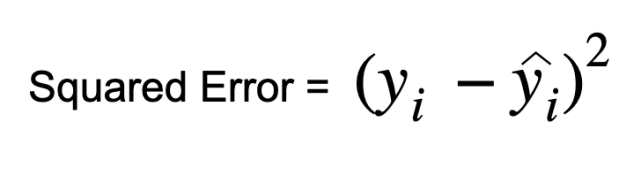
Squared Error/Loss Function-
The loss function is a method of evaluating how well your machine learning algorithm trains your featured data set. In other words, loss functions are a measurement of how good your model is in terms of predicting the expected outcome.
Loss Function Vs Cost Function
A function that calculates loss for 1 data point is called the loss function.
A function that calculates loss for the entire data point used is called the cost function.

The lower value of MAE, MSE, and RMSE implies higher accuracy of a regression model.
Error(Cost Function)
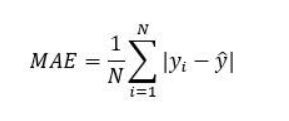
- MAE –Mean Absolute Error
The Mean absolute error represents the average of the absolute difference between the actual and predicted values in the dataset. It measures the average of the residuals in the dataset.
Advantage –
Easy To understand
Same unit
Robust to Outlier
Disadvantage –
Graph is not differentiable at 0
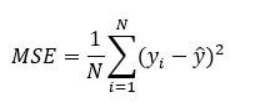
- MSE – Mean Squared Error
Mean Squared Error represents the average of the squared difference between the original and predicted values in the data set. It measures the variance of the residuals.
Advantage –
Use to calculate loss function, because Graph is differentiable at all point
Easy to interpret.
1 local minima
Disadvantage –
Unit are in Square
Not robust to outlier(if there is outlier, then it will not perform well)
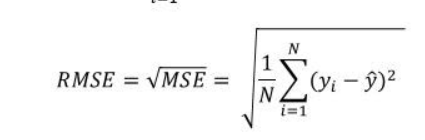
- RMSE – Root Mean Squared Error
Root Mean Squared Error is the square root of Mean Squared error. It measures the standard deviation of residuals.
Advantage – Same unit, Graph is differentiable at all point
Disadvantage –Not robust to outlier
- Huber Loss
Now we know that the MSE is great for learning outliers while the MAE is great for ignoring them. But what about something in the middle.
For example there is 25% abnormal point in the dataset,then we will not consider it outlier, to solve such issue we use Huber loss.
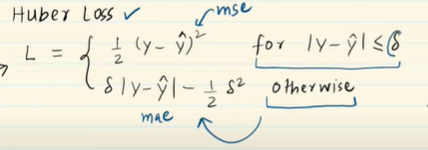
If data has outlier, then Huber loss function will behave like mean squared error, If there is no outlier then it will behave like mean absolute error.
Advantage – Same unit, Graph is differentiable at all point
Disadvantage –Not robust to outlier
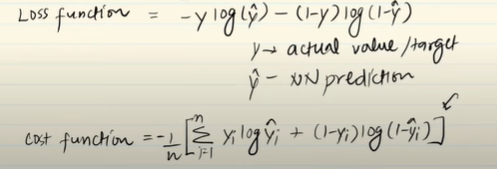
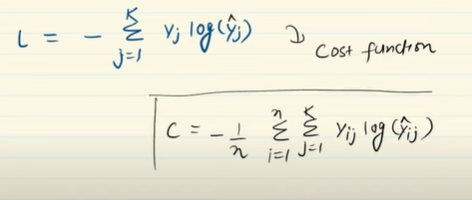
- Binary Cross Entropy Loss(Log Loss)
It is used for binary classification problem, if we have only two class like ‘YES’ or ‘NO’
Advantage –Graph is differentiable at all point
Disadvantage –Multiple Local minima
- Category Cross Entropy [Used in Softmax Regression][Deep Learning]
It is used for multiclass classification problem. If we have more than 2 class for example – Morning, Evening , Night.
Activation Function to be used is Softmax to train Multilayer Perceptron and no. of output should be same as no. of class.

Difference between Sparse Categorical Cross Entropy and Categorical Cross Entropy is?
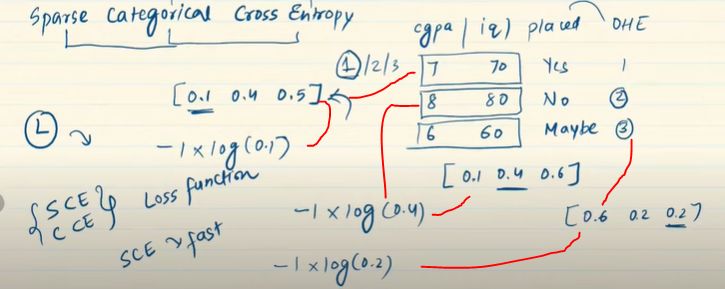
Both are same, only difference is Sparse Categorical Cross Entropy is fast, because in this there is no need to do one hot encoding
Formula for cost function
Accuracy
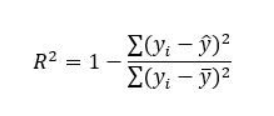
- R2 Score – Coefficient Of Determination
The coefficient of determination or R-squared represents the proportion of the variance in the dependent variable which is explained by the independent variable. R2 Score range from 0 to 1
OR
R2 score calculates to compare how much Linear Regression line is better than the Mean line
Higher R2 score is better than lower R2 score

SSr = Sum of squared error in Regression Line
SSm = Sum of squared error in Mean Line
R2 = 1 – SSrSSm
Disadvantage – It will not work in multiple input.
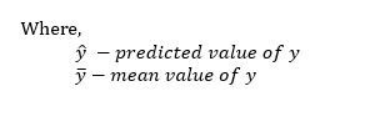
Here, yi is the observed target value, y(bar)i is the predicted value, and y-bar is the mean value, m represents the total number of observations.
R2 score can also be negative .(worst line)
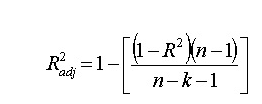
- Adjusted R2 Score
Adjusted R squared is a modified version of R square, and it is adjusted for the number of independent variables in the model, and it will always be less than or equal to R².In the formula below n is the number of observations in the data and k is the number of the independent variables in the data.
Why Adjusted R2 score come into picture, if we already have R2 Score?
If we add irrelevant column suppose, temp in cgpa-package dataset. Then k=1, denominator will decrease .hence R2 adjusted will decrease, which is right, but in case of R2 score it will increase. Hence, Adjusted R2 score come into picture.
But if we add relevant column suppose, IQ in cgpa-package dataset. Then k=1, denominator will also decrease and (1-R2) will also decrease. The rate of decreasing (1-R2) is much more than denominator. Hence Adjusted R2 score will increase in this case.